Work samples
-
 2016 homicide chart webimage.jpgThis is a drawing based on my series on homicide data in Baltimore City. Each wedge is a month, and it reads like a clock. Top right wedge is January. Each section in black is the day. The data was collected from Baltimore City Police reports and Baltimore Sun.
 -
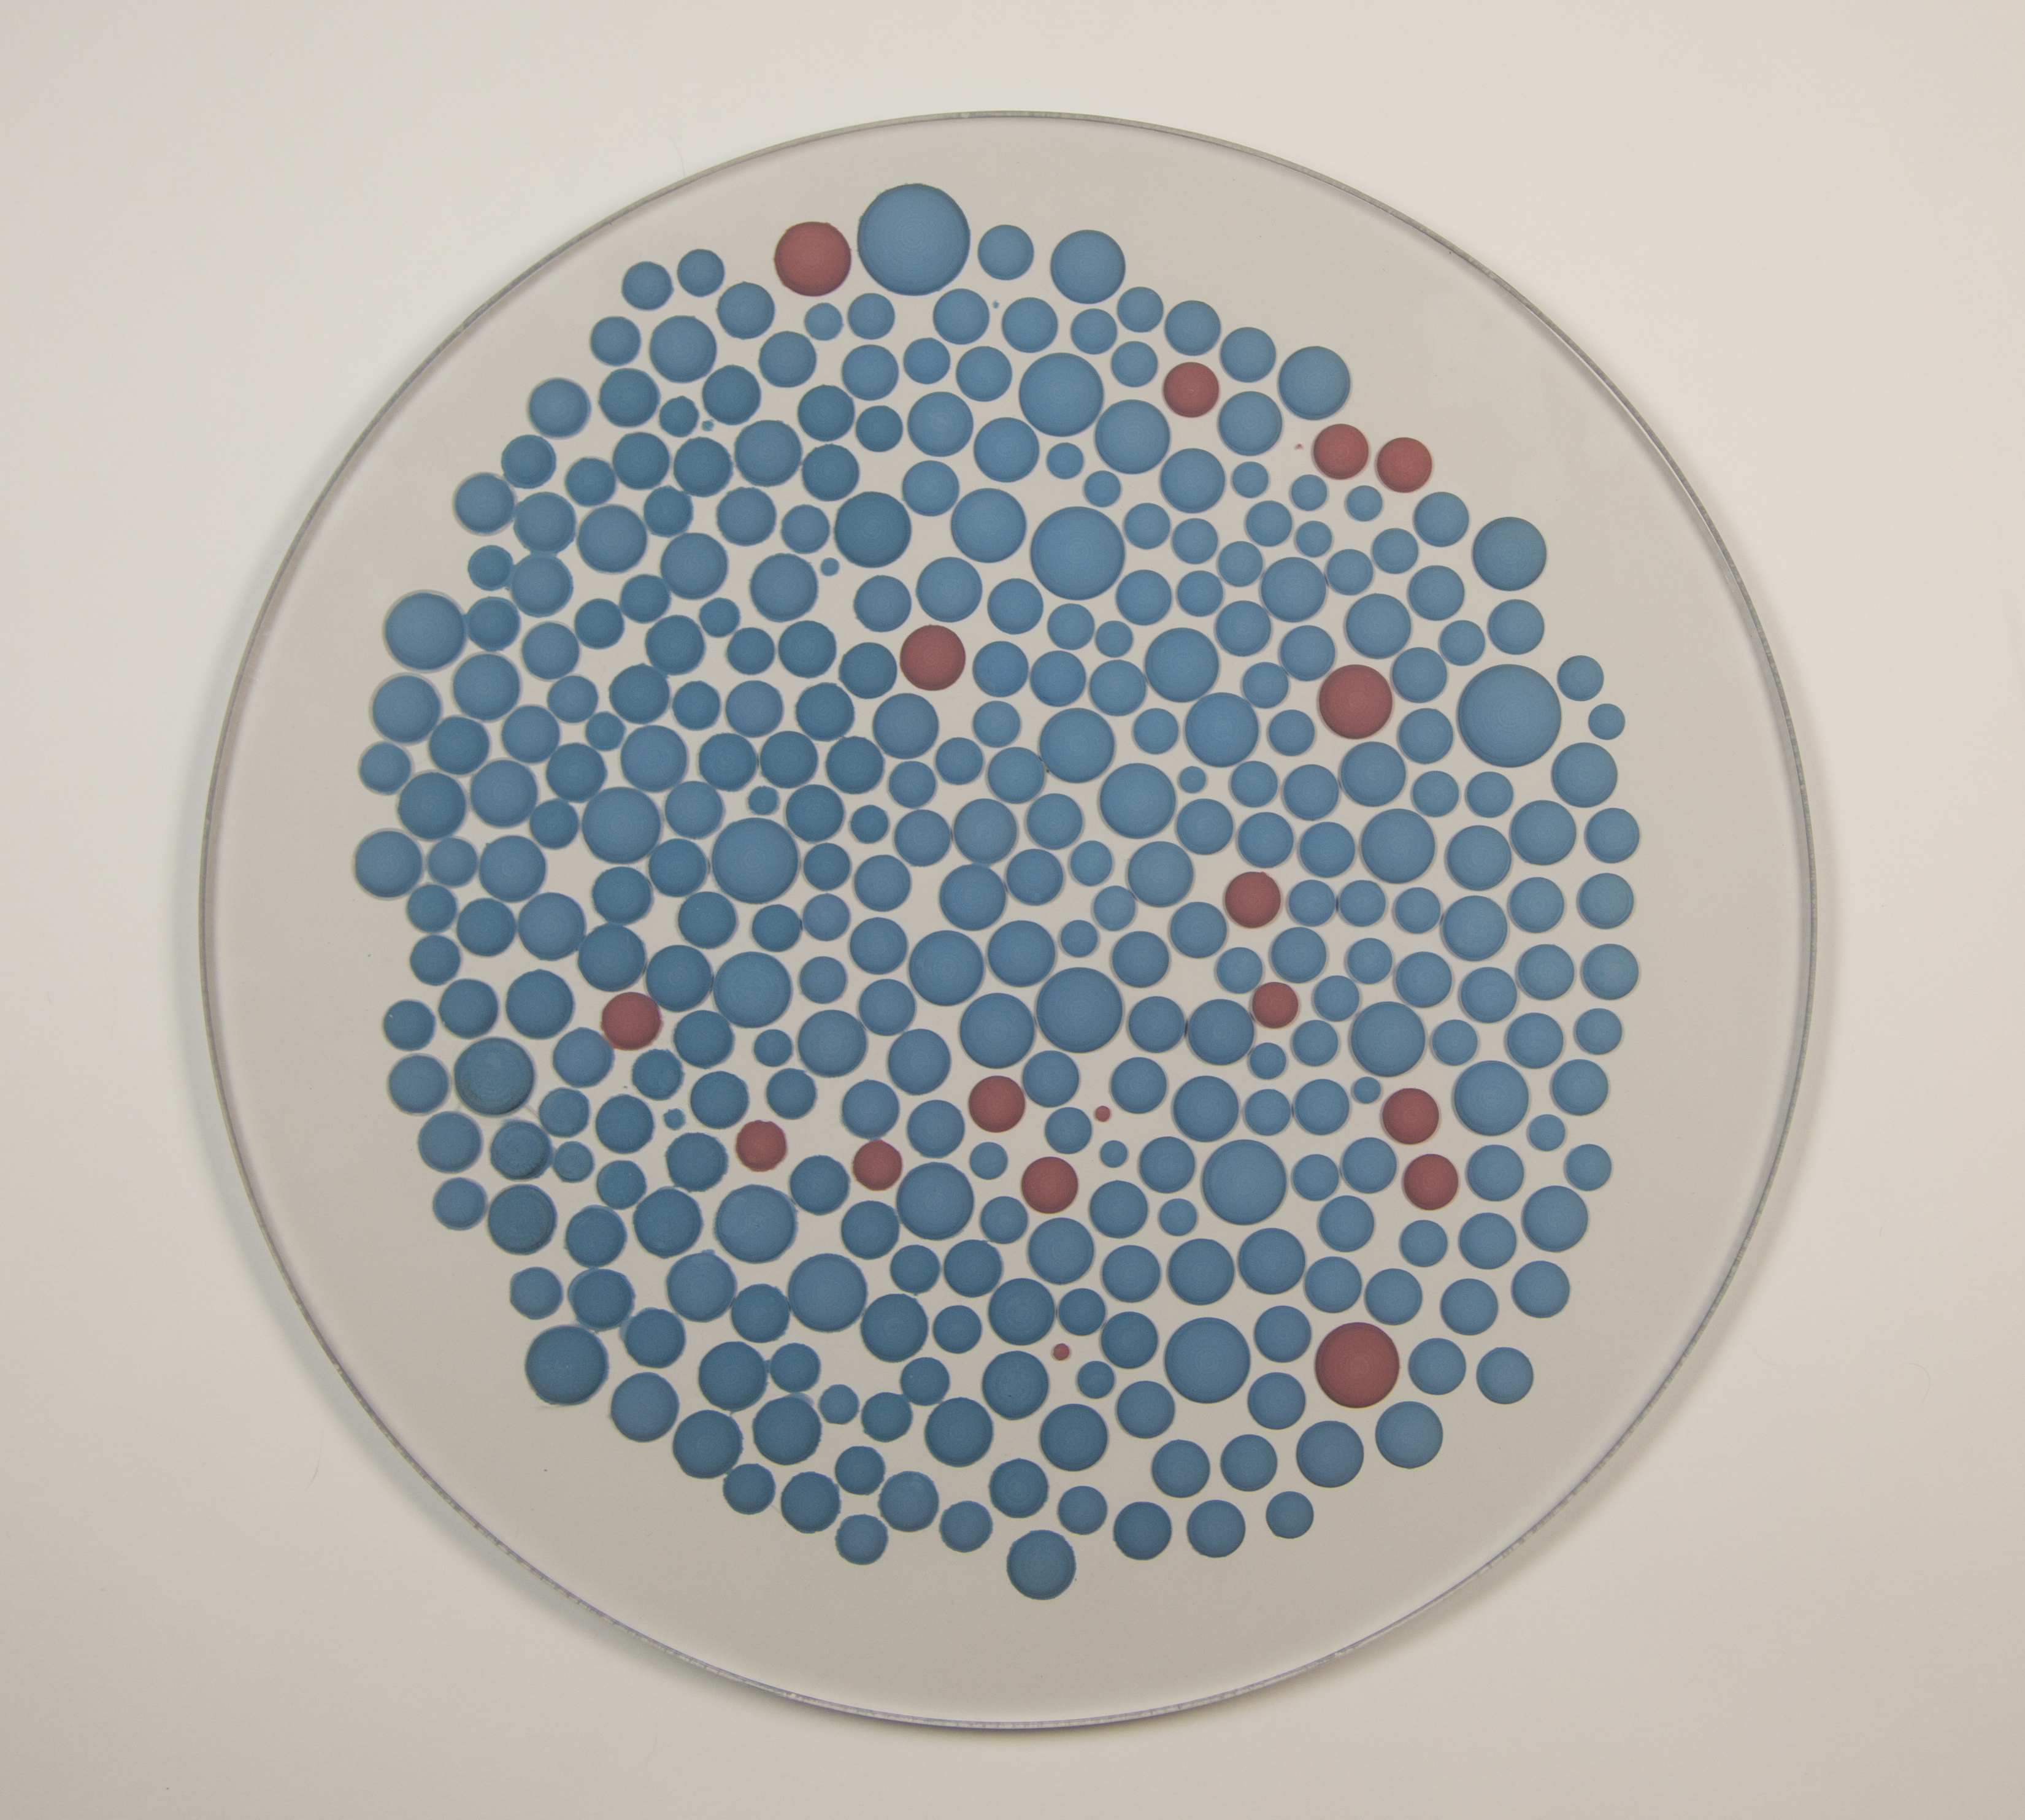
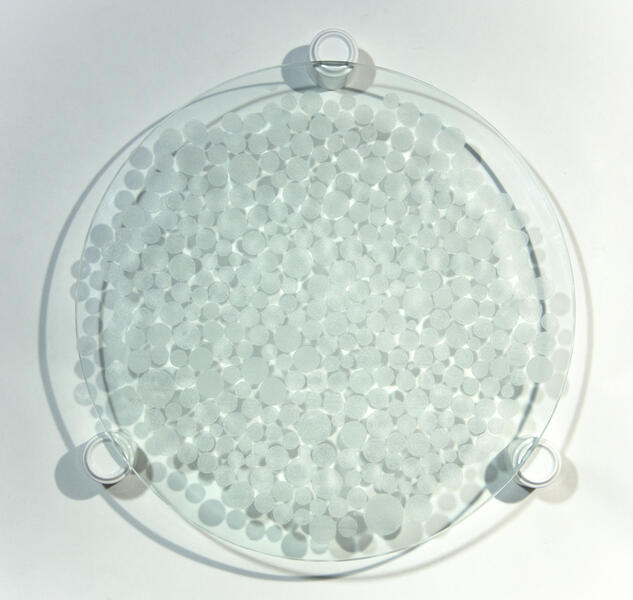 Age 2015This is a photo of a glass sculpture from my homicide data series. Each circle is a person that was murder in 2015. The size of the circle determines the age of the person. The smallest circle represents 0-1 years old. The largest circle represents oldest age range (70 yrs.+). The sculpture is a flat glass disk that is 18 inches in diameter. Data collected for this artwork was gathered from Baltimore City police reports and Baltimore Sun.
 -
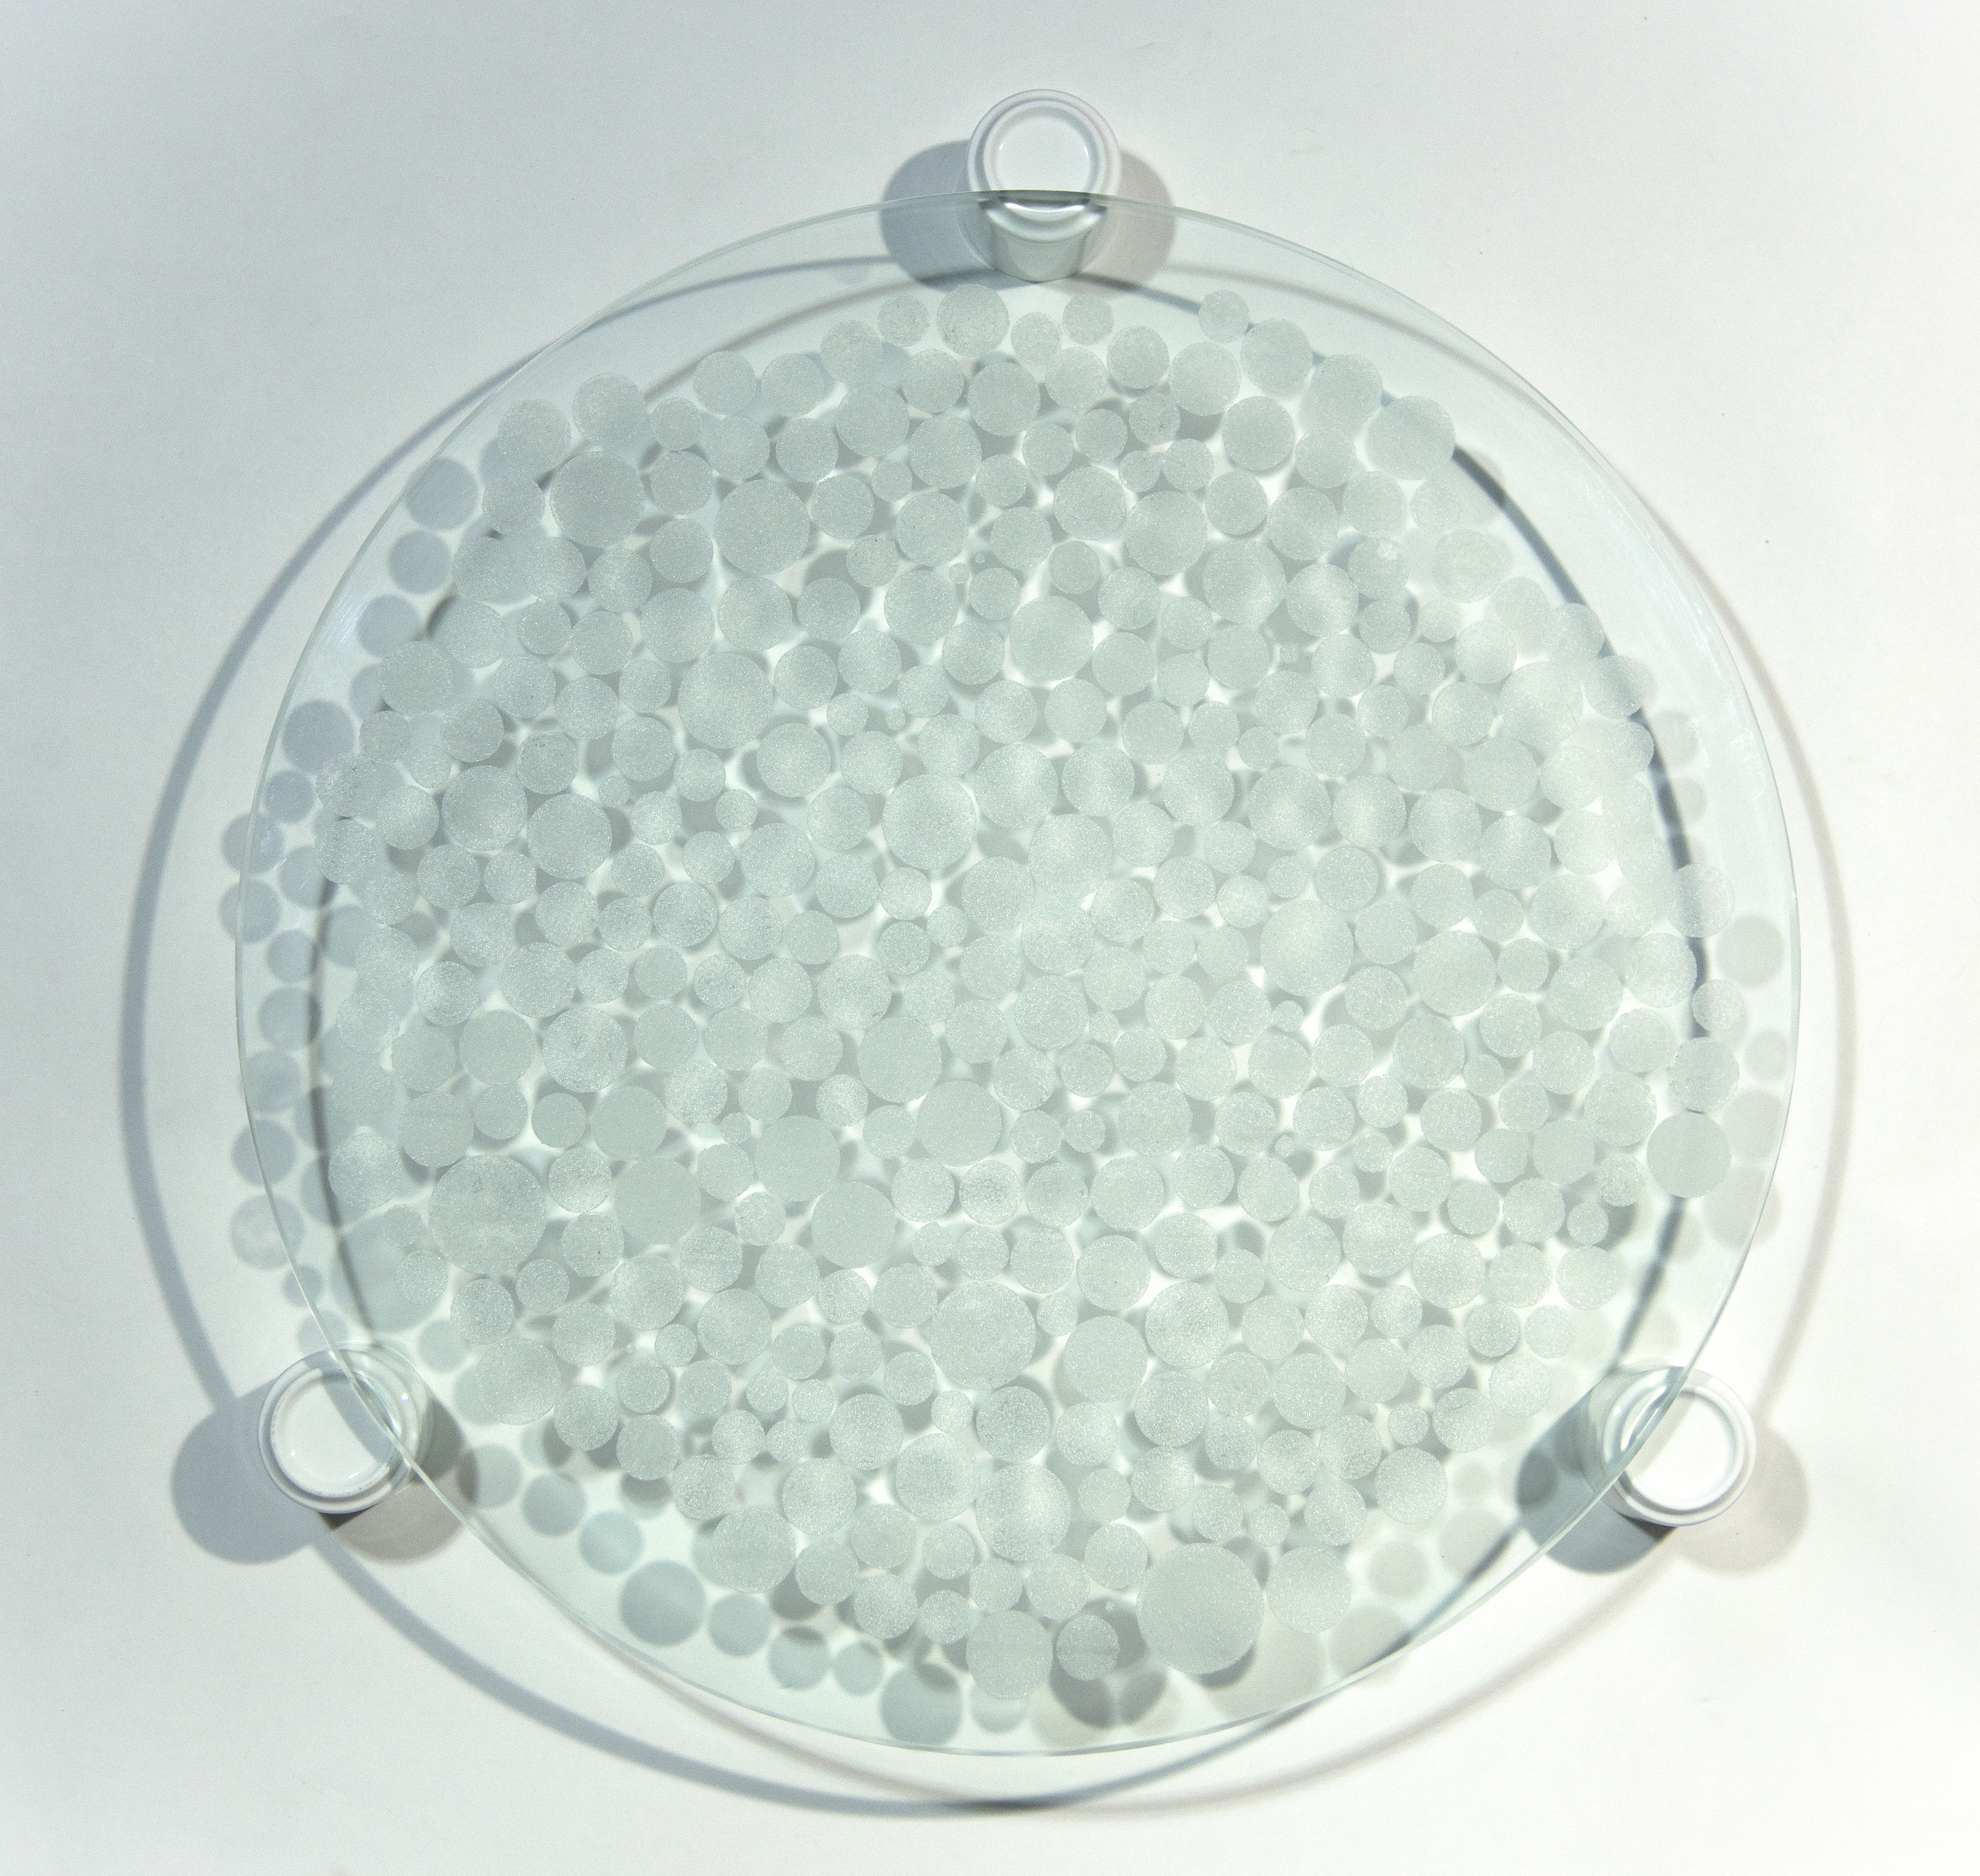
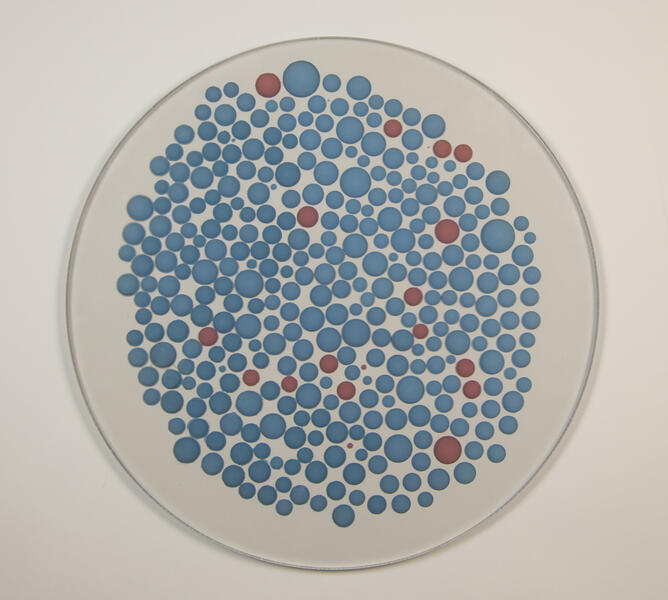 Age and Gender 2015This image is a sculpture from my homicide data series. It is made from plexiglass with half circles carved into it. Each circle represents a person that was murdered in 2015. The blue represents male victims, and the pink represents female victims. The circle sizes are different age groups. The smallest size equals the 0-1yrs old age group, and the largest size circles represent the oldest age group (70 yrs. old and up). Data for this piece was gathered from Baltimore City police reports and the Baltimore Sun.

About Cassandra
Baltimore City - Bromo Tower Arts District

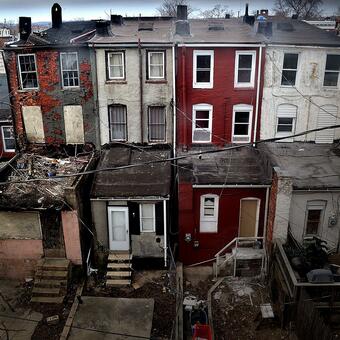
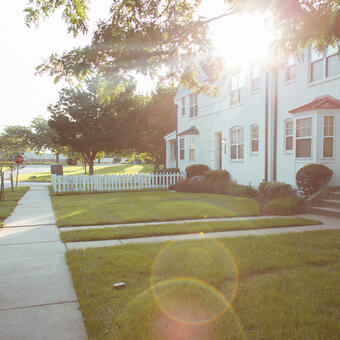
Cassandra is a fine art and commercial photographer and digital artist. Through her photography she explored the wonders of light as well as her community. She was formally trained in photography, and worked with several commercial studios in Missouri and New York before going out to work on her own professionally. Cassandra undertakes commercial photography work in interior design and portraiture.
Her fine art photography is exhibited throughout the northeast from Maryland Art Place… more
Her fine art photography is exhibited throughout the northeast from Maryland Art Place… more
What's in the Numbers? (Homicide Data Project)
-
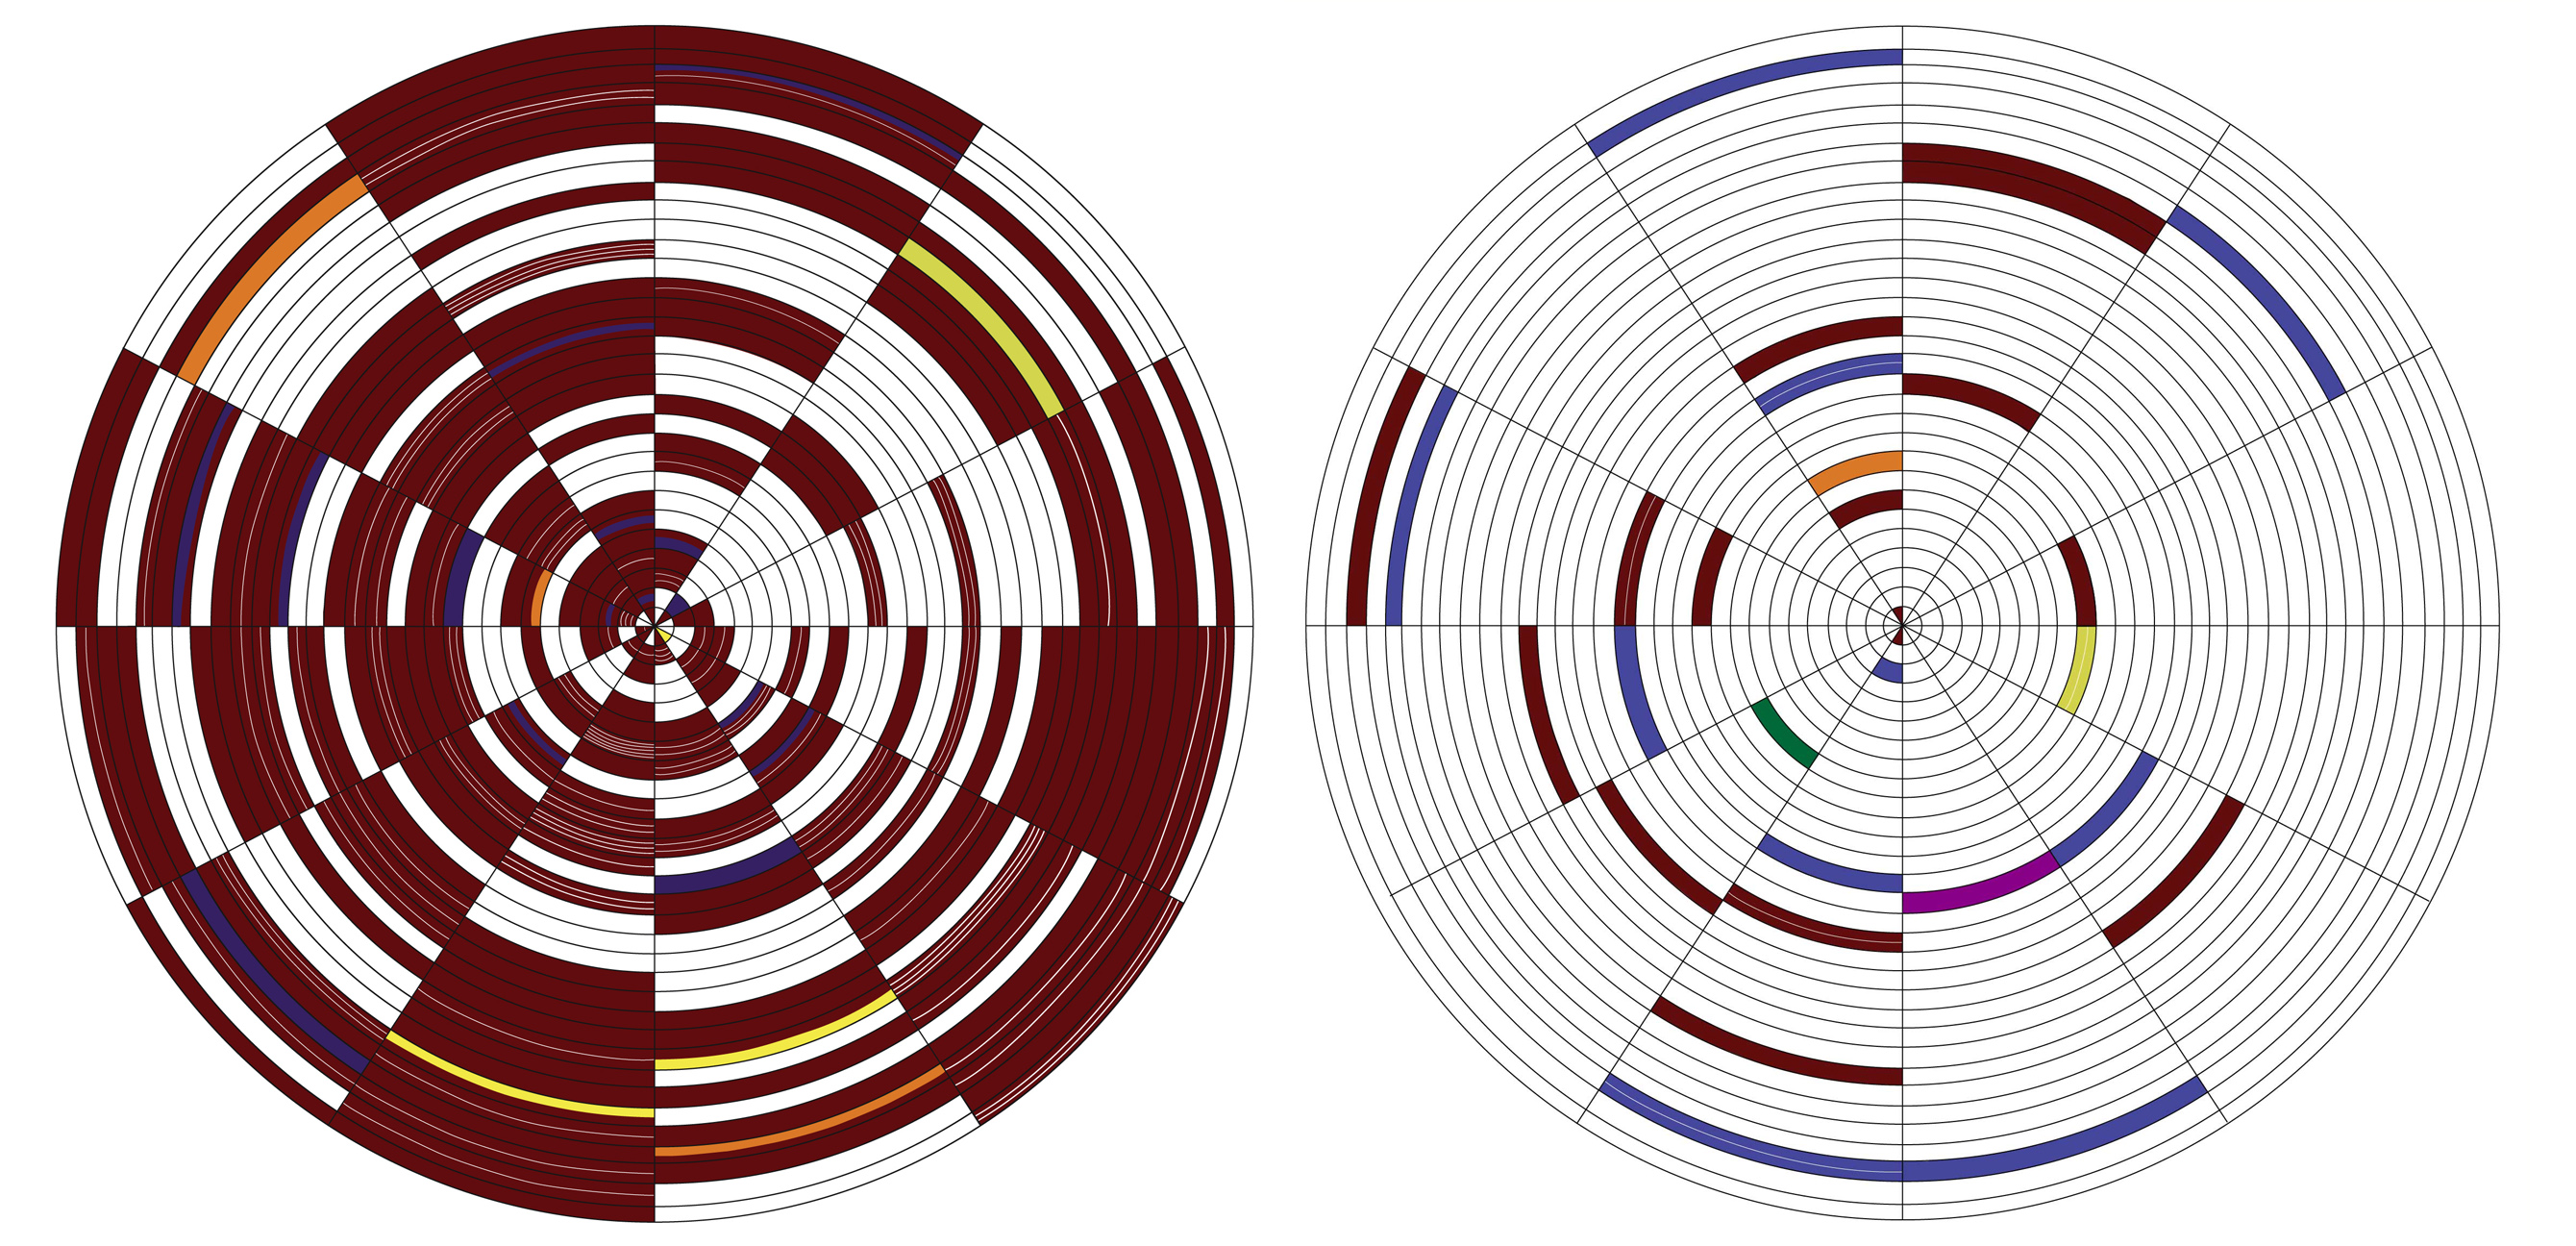
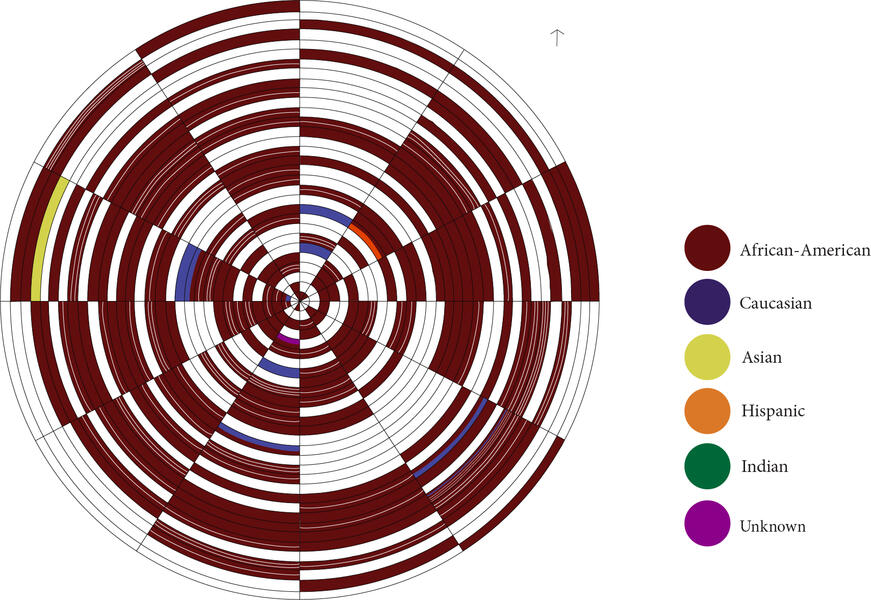
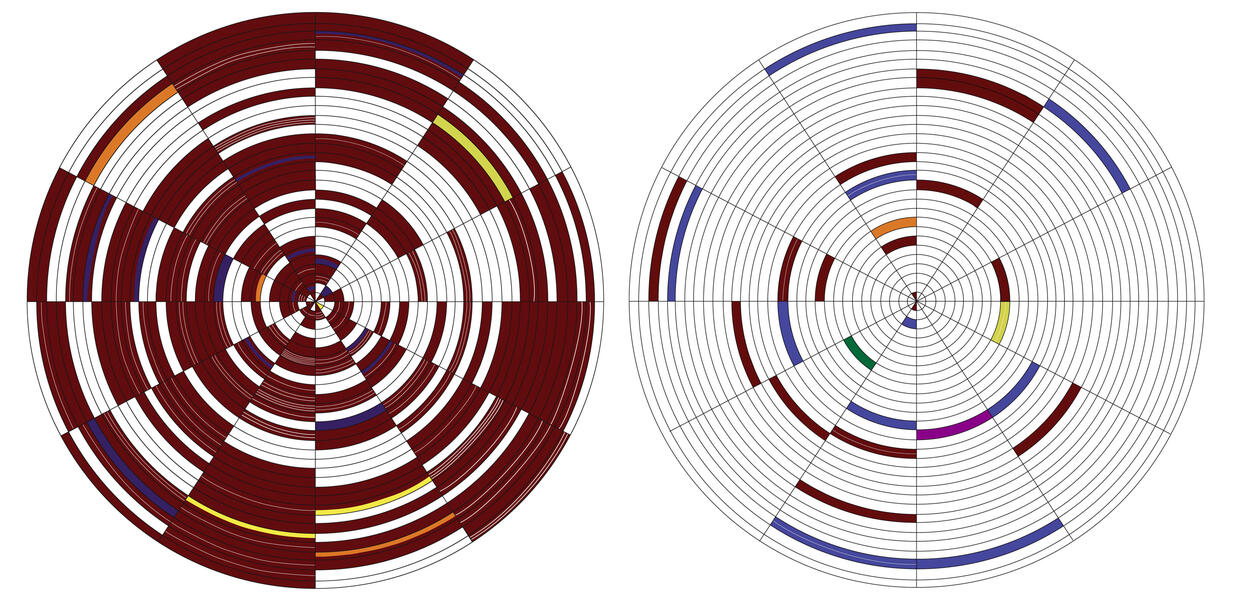 Baltimore City and Baltimore County 2015 Homicide CalendarsThe drawing above is based on my homicide data series. Each circle is a calendar drawing of the homicides in 2015 in Baltimore City (left side) and Baltimore County (right side). Each wedge represents a month, and the black sections in the wedge represents a day in the month. The first day of each wedge starts in the center and builds up to the last day of the month on the edge. The colors used in the drawings represents race. The drawing was created based on the data collected from both the baltimore city and county police reports. Please, visit my project section to see a closer look of the drawing.
 -
Age and Gender 2015This image is a sculpture from my homicide data series. It is made from plexiglass with half circles carved into it. Each circle represents a person that was murdered in 2015. The blue represents male victims, and the pink represents female victims. The circle sizes are different age groups. The smallest size equals the 0-1yrs old age group, and the largest size circles represent the oldest age group (70 yrs. old and up). Data for this piece was gathered from Baltimore City police reports and the Baltimore Sun.
-
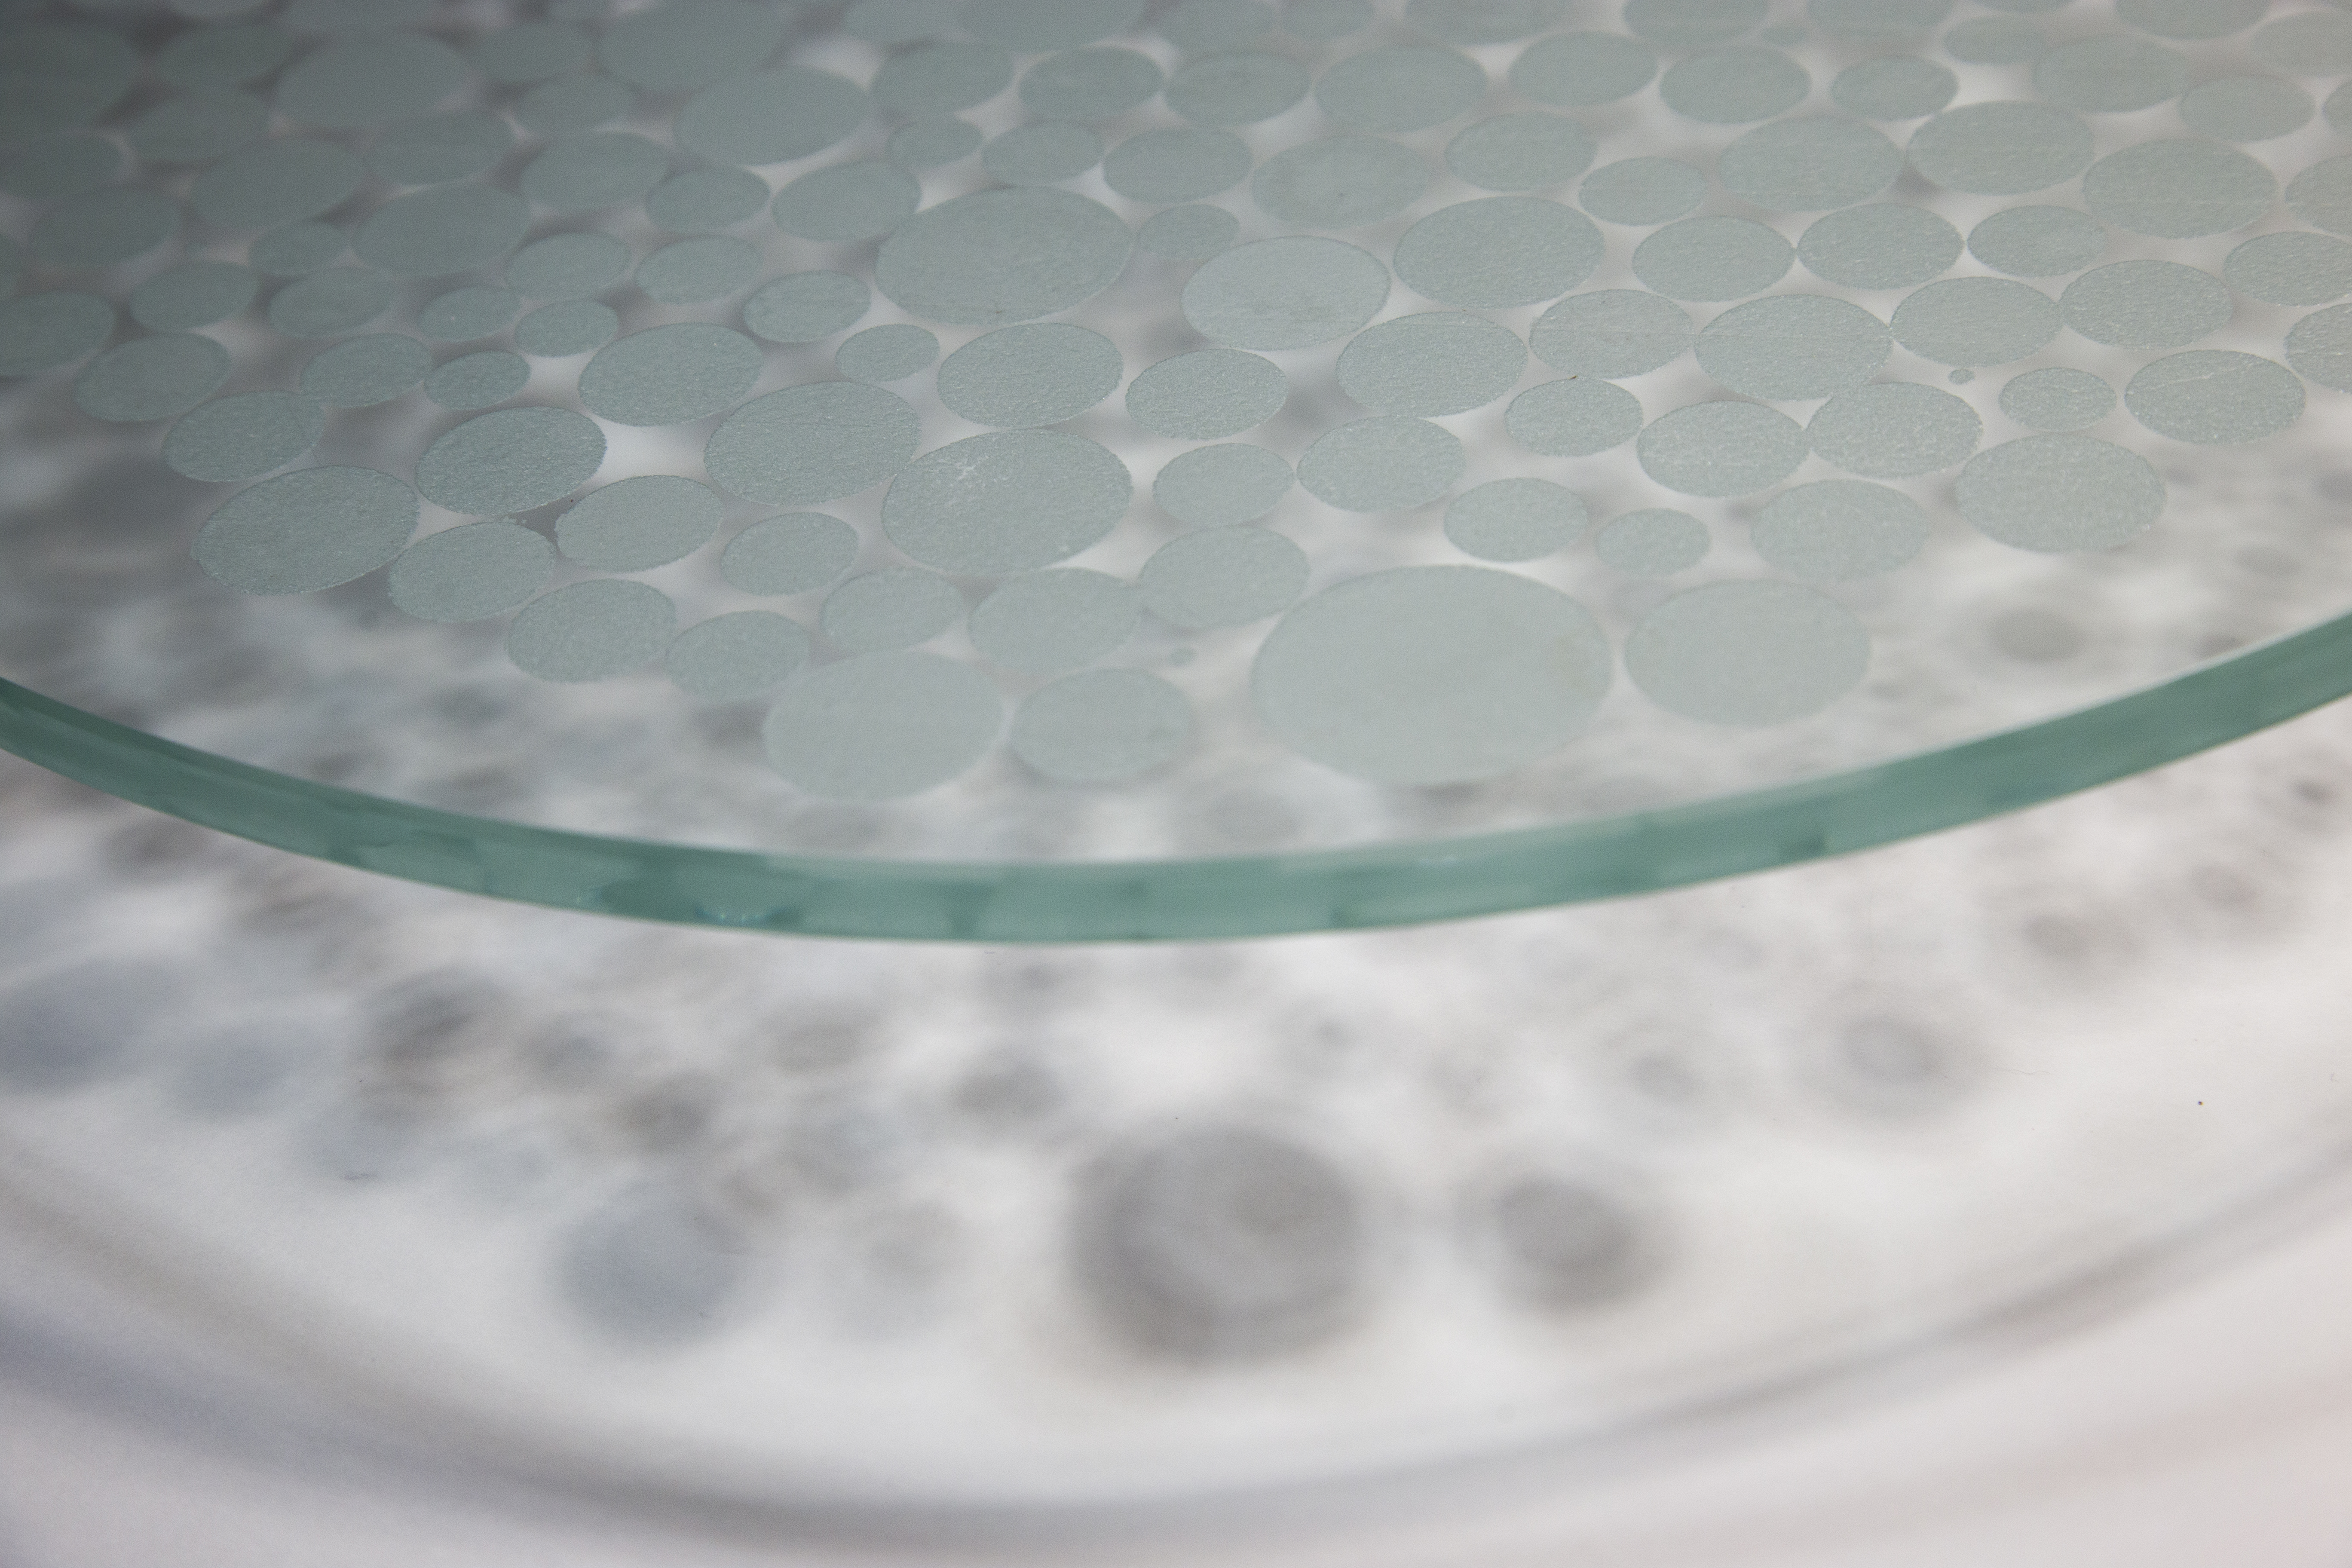
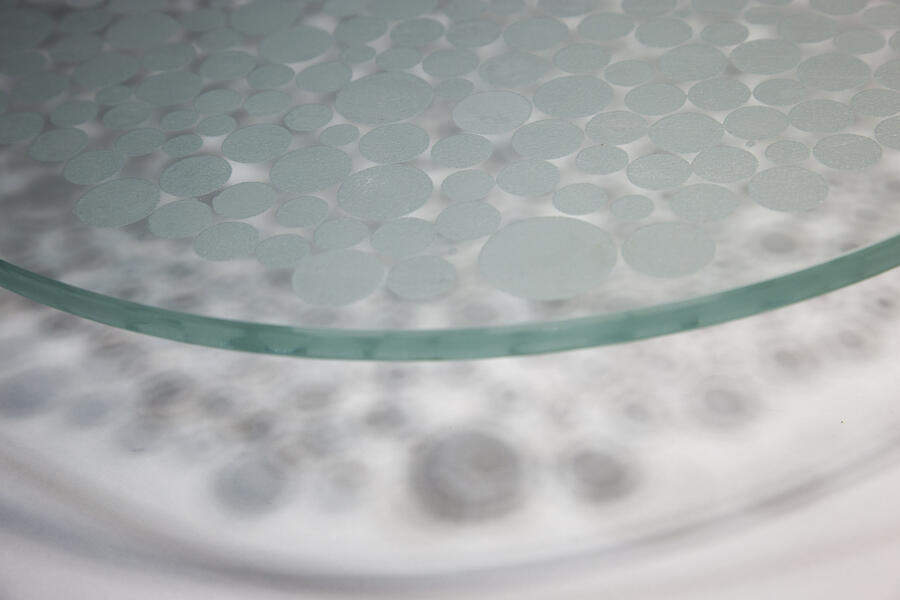 Age 2015Close-up, side view of glass sculpture based on the age of Baltimore homicides in 2015. Digital laser print on glass, to be displayed at least 2 inches away from surface.
 -
Age 2015This is a photo of a glass sculpture from my homicide data series. Each circle is a person that was murder in 2015. The size of the circle determines the age of the person. The smallest circle represents 0-1 years old. The largest circle represents oldest age range (70 yrs.+). The sculpture is a flat glass disk that is 18 inches in diameter. Data collected for this artwork was gathered from Baltimore City police reports and Baltimore Sun.
-
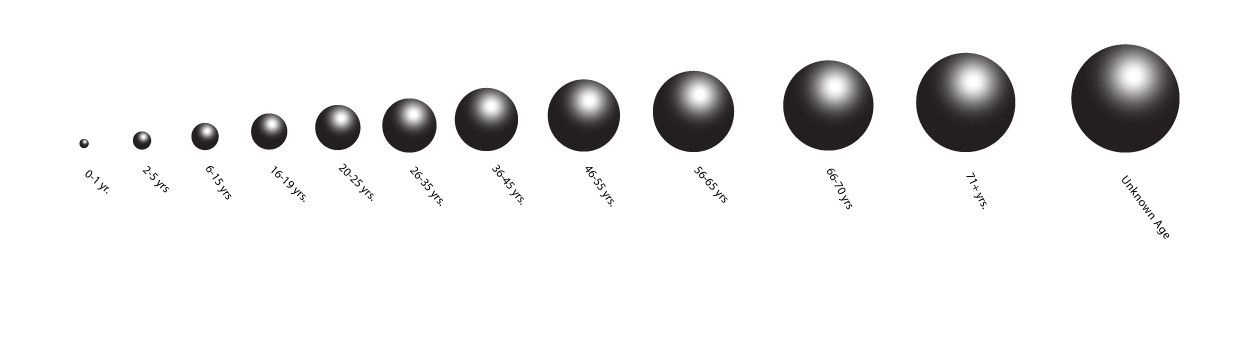
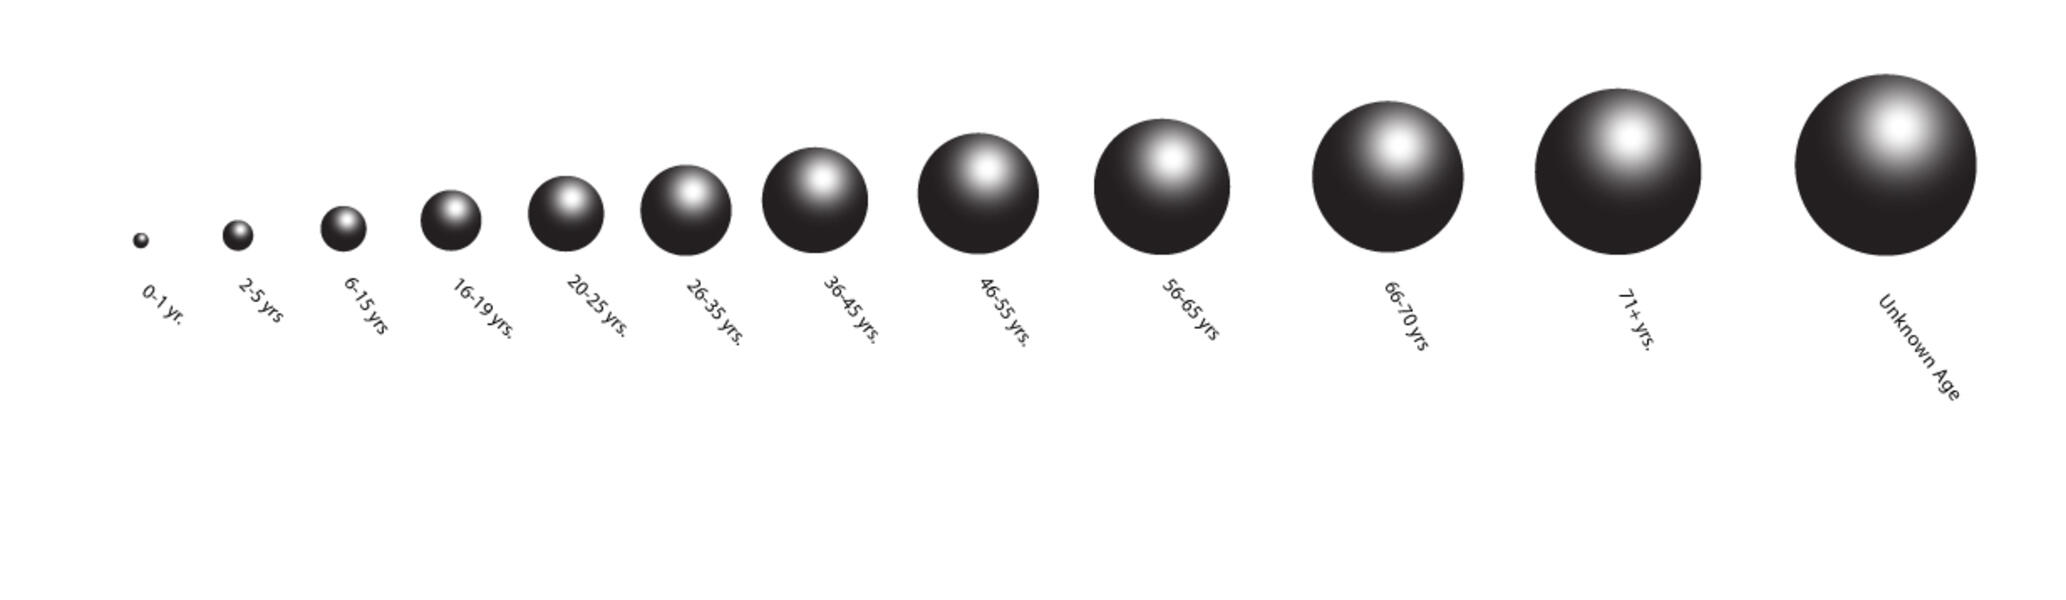 Cassandra-Kapsos_Age-key-label_2015.jpgKey label for "Age 2015" and "Age and Gender 2015"
 -
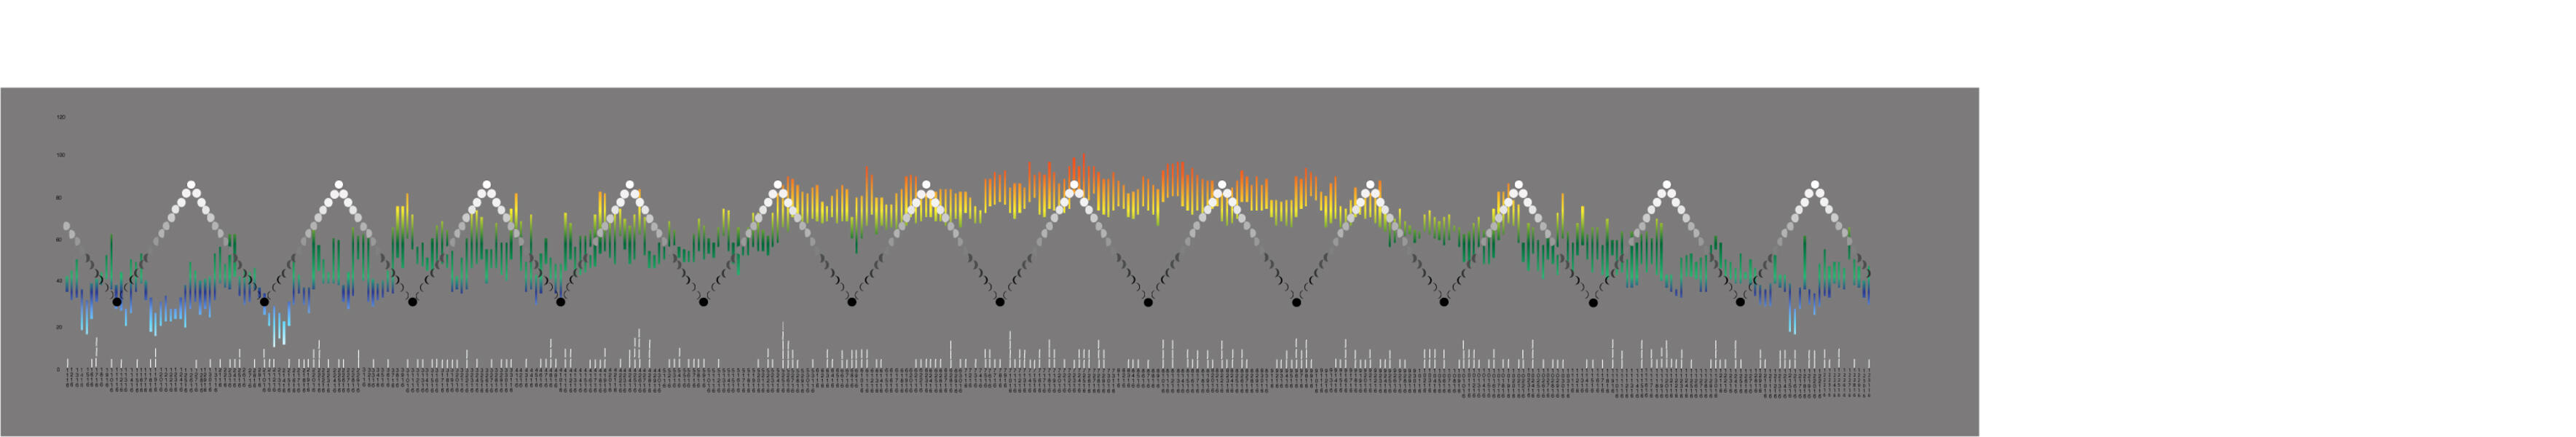 Final Data Movement.jpgThe temperture, moon phase, and homicide number for each day in Baltimore for 2015.